AI data visualisation for UK decision-makers

AI dashboards that reveal what spreadsheets hide.

Stop wrestling with exports and stale reports. We build bespoke analytical dashboards that turn raw operational data into clear next steps, so your team can move faster without second-guessing the numbers. Why wait weeks for answers?

Scroll for the proof.
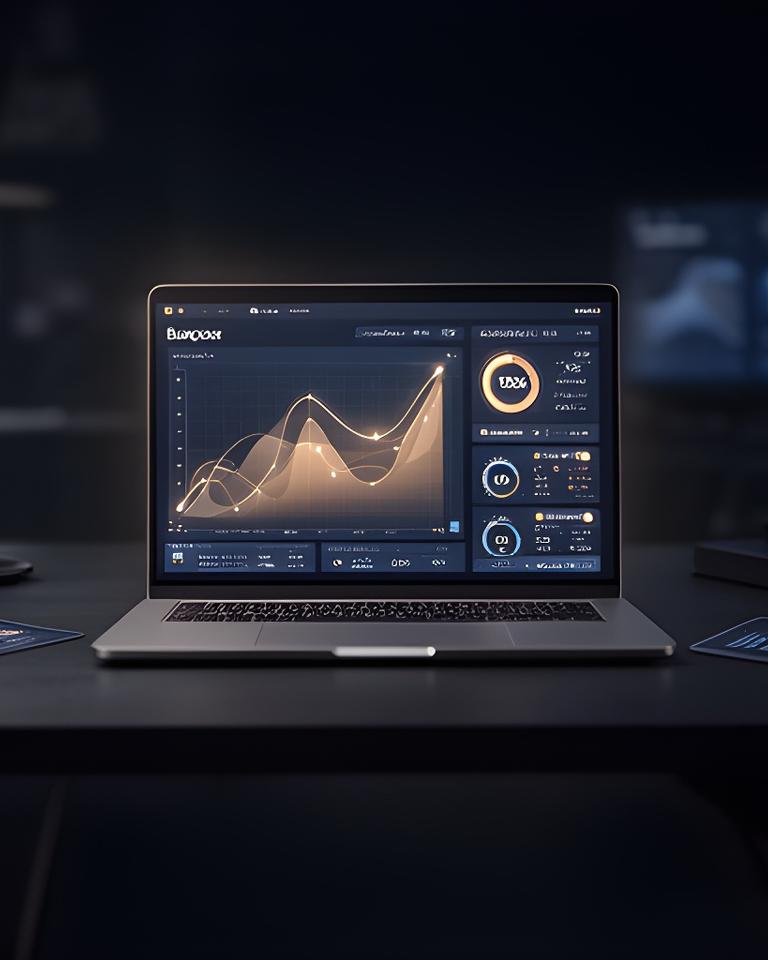
Sleek laptop on a dark desk showing an interactive AI dashboard with charts, trend lines and highlighted performance metrics
Built for retail, fintech, healthcare and logistics

Sharper reporting. Cleaner decisions. A dashboard your leaders will actually use.

Trusted by UK enterprises

Confidence first. Hype later.

Can your current reporting stack keep up with board meetings, compliance checks and operational deadlines? Ours does, because it’s built for reliability from day one.

200+Dashboards deployed across growing UK organisations
99.9%Uptime SLA for teams that cannot afford guesswork
ISO 27001Security-first delivery for sensitive business data
High street retail London fintech Private healthcare Fleet logistics Property analytics Manufacturing ops
End-to-end AI dashboard services

A bento grid of practical services.

Need one dashboard to calm the noise, or a full reporting suite that scales across departments? We design the lot, then hand over something your team can trust.

Retail trading dashboards

Track stock, sell-through and basket trends at a glance.

Learn more

Fintech risk visualisation

Spot anomalies early and keep compliance teams calm.

Learn more

Healthcare outcome reporting

Bring patient metrics, pathways and trial outcomes together.

Learn more

Logistics performance boards

See routes, fuel use and fleet productivity in one place.

Learn more
Built for your industry

Different sectors. Same clarity.

Each industry comes with its own metrics, regulations and pressure points. Why force them into the same template? We don’t.

Retail snapshot

More stock confidence. Less guesswork.

For a boutique coffee chain, we combined till data, supplier lead times and seasonal demand into a single live view. The team saw stock-outs drop by 28% once they could act before the shelves emptied.

28% stock-outs reduced
15 min weekly stock review, not hours
See the retail approach
Retail manager reviewing a glowing stock dashboard on a tablet beside neatly arranged café shelves
AI-powered reporting ROI calculator

What could you gain in a year?

A rough estimate is enough to start. If your reporting process is swallowing hours every week, the savings can be surprisingly sharp.

Based on a retail SME profile, we’d suggest a Sales Dashboard first. Why? It delivers immediate visibility without overcomplicating the rollout.

Recent success stories

Proof beats promises.

These are the kinds of outcomes businesses come to us for. Different sectors, same result: better decisions, faster.

Hospitality retail

Boutique coffee chain

Inventory forecasting dashboards linked supplier timing with live sales data, reducing stock-outs by 28% and saving managers from weekend fire-fighting.

28% fewer stock-outs
1 view for stock and demand
Read full story
Fintech

London fraud prevention team

Anomaly detection visualisation surfaced suspicious behaviour earlier, helping the team prevent fraud losses of £1.2M. Why bury that signal in a report?

£1.2M losses prevented
Early warning signals
Read full story
Healthcare

Private clinic trial tracker

Outcome reporting brought patient milestones into one visual tracker and improved trial completion rate by 19%. Clarity matters when every delay has a cost.

19% higher completion rate
One clean patient view
Read full story
Your journey from raw data to clarity

A straightforward four-step path.

No endless discovery theatre. We keep the process tight so you can see value early and steer the build as it takes shape.

1

Data Audit & Discovery

We map your sources, pain points and priorities, then identify the quickest wins.

2

Design & Prototype

You’ll see a working concept fast, with visual direction that matches how your team thinks.

3

Agile Build & Train

We iterate with your stakeholders, keep feedback loops short and train the people who need to own it.

4

Launch & Support

Once live, we stay close. Because a dashboard is only useful if it keeps answering questions.

Real people, real expertise

A London team with genuine mileage.

We’re not a faceless software shop. Our team has 50+ collective years in data, product design and delivery, and it shows in the details.

Portrait of Lijy Baskeyfield in a modern London studio with a calm, focused expression

Lijy Baskeyfield

Lead Data Scientist

Transforms healthcare and operational data into dashboards that people actually trust.

Portrait of Azouz Solez in a bright workspace beside multiple monitor screens

Azouz Solez

UX Lead

Designs clean, decision-first interfaces that cut through clutter in seconds.

Portrait of Ceaden Eshetu standing in an office with analytics charts displayed on screens behind him

Ceaden Eshetu

Head of Client Success

Keeps delivery honest, practical and aligned to the outcomes your board wants.

Portrait of Sumnesh Kutka in a creative workspace with a laptop and data sketches on the table

Sumnesh Kutka

CTO

Builds secure, cloud-native systems with the boring reliability good reporting depends on.

What our clients say

A few words from the people using it.

We can talk about dashboards all day, but a simple question matters more: did the team feel the difference?

Common questions, answered

The practical stuff, upfront.

If you’re still weighing this up, fair enough. These are the questions we hear most often before a project gets moving.

How long until I see a working dashboard?
Usually 4–6 weeks for a prototype, depending on source complexity and stakeholder availability. Want to see progress quickly? That’s exactly how we like it.
Do you integrate with existing tools?
Yes. We support 50+ native connectors and can work with the systems you already use, from CRMs to finance platforms and warehouse tools.
Is this secure for patient and financial data?
We design with GDPR, NHS DPST expectations and FCA-aware controls in mind. Sensitive data stays governed, logged and tightly scoped.
What if I don’t have a data scientist?
No problem. We handle discovery, data modelling, dashboard build and handover, so your team can focus on using the insight rather than building the plumbing.
Free resources to get you started

Useful before you buy.

If you’d rather read, download or watch first, these resources will help you frame the brief properly. Why start blind?

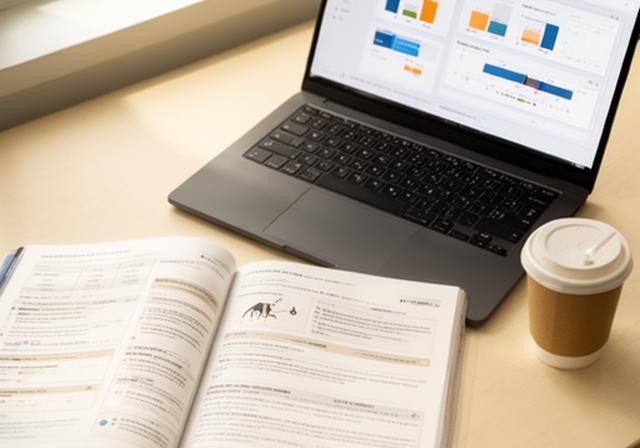
Printed guide and laptop on a desk beside a coffee cup, showing a dashboard planning checklist

The SME Guide to AI Dashboards

A plain-English eBook for teams that want to get started without drowning in jargon.

Download PDF
Retail operations checklist beside a laptop with charts and handwritten notes in a meeting room

Retail Sales Dashboard Requirements Checklist

A practical template to help you capture the data, KPIs and decisions that matter most.

Get template
Conference laptop showing a fraud analytics webinar screen with charts and presenter slides

Spotting Fraud with Visual Analytics

Watch on-demand and see how clear visual design changes early-warning detection.

Watch on-demand

Let’s build your first AI dashboard.

Free for 30 days. No commitment, no card required. Prefer a quick conversation first? Call +447457756970.