£347k
Average fraud value prevented per client after dashboard deployment.
Fraudsters move faster than rules. Our AI dashboard spots the patterns humans miss before the money leaves, turning transaction noise into clear decisions for compliance and risk teams. Why chase hundreds of false positives when the real story can surface in seconds?

We built these visualisations for teams who need sharper triage, clearer audit trails and cleaner hand-offs. No jargon. Just evidence that stands up in the room.
Average fraud value prevented per client after dashboard deployment.
Faster investigation closure when analysts work from ranked, explainable alerts.
Pattern recall on recurring schemes when models combine graph and transaction history.
Unsupervised learning, graph analysis and explainable scoring work together so your analysts can move from pattern hunting to action. What if the dashboard could tell you not just that something is wrong, but why it looks wrong?
We cluster expected transaction flows by customer segment, device behaviour, velocity and counterparties, then surface the outliers that don't belong.
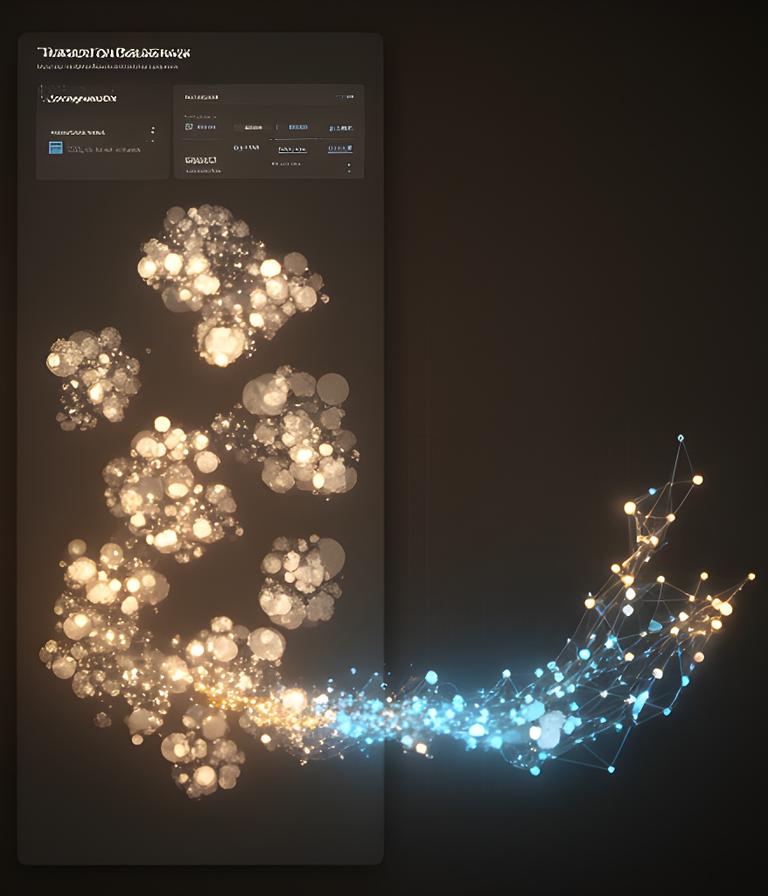
Auditors don't want mystery maths. They want traceable evidence, timestamps and a clean rationale.
Flag high-risk payments before settlement and keep your monitoring queue moving.
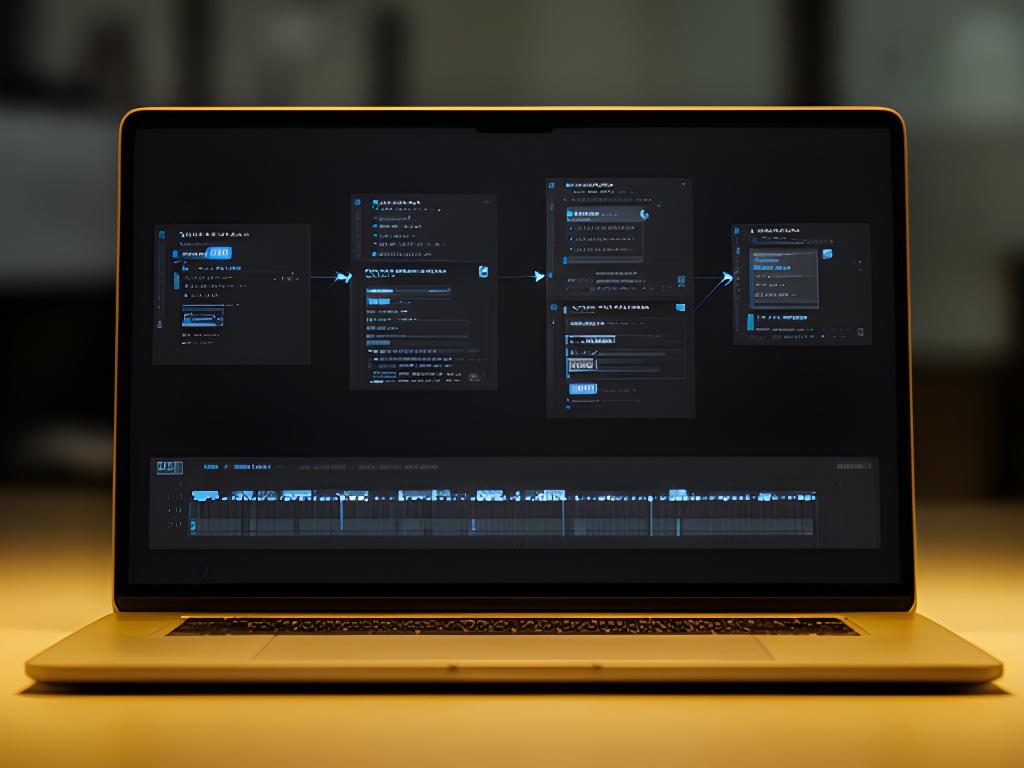
A clean event timeline turns dense transaction records into a readable sequence of actions, anomalies and interventions. The team sees the path. The regulator sees the proof.
Different fraud moments need different views. Which stage is costing you most time right now?
Spot synthetic identity patterns, repeated devices and suspicious address networks before the account is approved.
Designed for sharp first-pass decisions, with a clear reason code for every hold.
Rank incoming transfers by risk, velocity and graph proximity so analysts can focus on the right queue first.
Built for constant flow. Fast triage, minimal friction.
Highlight wash trading, layering signals and unusual counterparties to support market abuse investigations.
Clear enough for operations, rigorous enough for governance.
Your team needs a record that can stand up under scrutiny. Why settle for a black box when you can have a decision trail that is readable, searchable and audit-friendly?
Each case includes signal summaries, related entities, confidence bands and the exact events that triggered the alert. That makes handovers cleaner and reviews shorter.
The best feedback sounds simple. Faster reviews. Less guesswork. Better training. Isn't that what good operational tooling should deliver?
We cut investigation time from hours to minutes. The dashboard shows the pattern and the evidence in one place, so our team stops chasing noise.
The visual patterns made training new analysts effortless. Our false positives dropped quickly, and the whole team trusts the triage flow far more than our old rule set.
Why did we choose Emery Apex Group? Because the explanation is as strong as the detection. Our auditors can follow it, and our analysts can act on it without delay.
Tell us what you're monitoring and we'll shape the demo around your risk priorities. SOC 2-aligned handling, clear next steps, no wasted time.